HabitApp Shade Measurement Tool
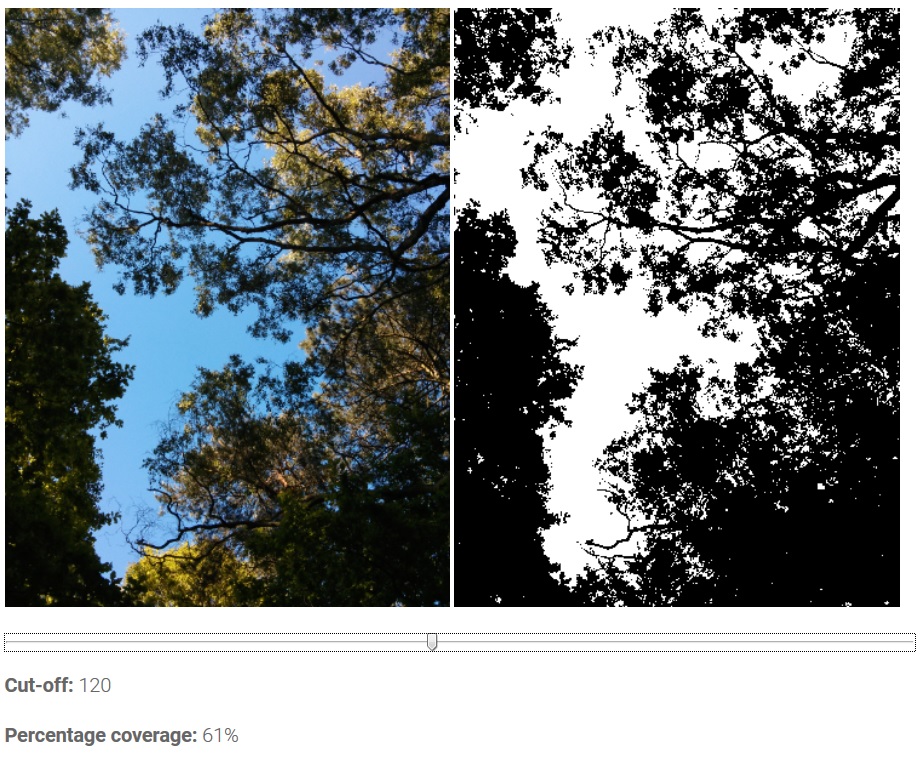
Shade is a vital component of many coffee production systems. However, it is very difficult to determine the optimum level of shade. Thus, a mobile app called HabitApp helps to give an instant reading of coffee shade cover. The HabitApp, a free mobile app available at http://wwhttps://play.google.com/store/apps/details?id=com.scrufster.habitapp&hl=en&utm_source=global_co&utm_medium=prtnr&utm_content=Mar2515&utm_campaign=PartBadge&pcampaignid=MKT-AC-global-none-all-co-pr-py-PartBadges-Oct1515-1 gives an instant reading of coffee shade cover, an important variable that was previously very time-consuming and difficult to measure accurately. Rather than requiring specialist equipment like a spherical densiometer, this app turns mobile phone photos into black and white images and then calculates the percentage shade value (black pixels as a percentage of total pixels).

Concept
Shade is a vital component of many coffee production systems. However, it is very difficult to determine the optimum level of shade:
- Too little shade exposes coffee to high sun temperatures, causes excessive flowering and exposure to wind, hail etc.
- Too much shade can lead to poor yields and in some cases higher incidences of disease.
- The ideal shade level varies according to altitude, annual hours of sunshine, slope orientation and time of year.
Until there is a reliable model available, shade levels need to be set according to local conditions; many farmers may have achieved close to optimal shade levels through a process of trial and error and it is therefore important to quantify this variable so that it can be more faithfully reproduced elsewhere . It is therefore important to be able to accurately and routinely quantify shade levels from a wide range of field conditions. Photography – wide angle vertical shots taken above or well to the side of coffee trees – is the most effective way to do this, but previously this has required time-consuming post-field analysis and has only been possible with specialist equipment that has been beyond the reach of most fieldworkers. HabitApp, a free app developed by UK-based software group Scrufster, allows you to measure shade cover with your smart device or computer easily, accurately and continuously. Using your smart device or computer, you can upload a photo of the canopy over your farm and HabitApp will measure shade cover by converting the pixels to black and white and calculating the percentage of black pixels to total pixels. Given the ease of use, the app can be used with multiple images in different light conditions and cloud cover to get an average coverage value. The free Android app does not require internet or mobile signal once downloaded, and is accessible via phone, Windows desktop, or through the Scrufster website.
Drawbacks
- No Mac version. Android mobile app, Windows laptop or online versions only.
- No experimental data. Currently no experimental data to show how accurate the device is.
- Not accurate when the sun is included in the photo.
Costs
App software is free to download.
Recommended Activities
- Download the app at https://play.google.com/store/apps/details?id=com.scrufster.habitapp&hl=en&utm_source=global_co&utm_medium=prtnr&utm_content=Mar2515&utm_campaign=PartBadge&pcampaignid=MKT-AC-global-none-all-co-pr-py-PartBadges-Oct1515-1
- Take several measurements. Shade is never uniform so several measurements are required. The number of photos to take will vary according to type of shade — for example, shade produced by a mix of different tree species will require more readings — and accuracy required, but plan to take at least 20 photos across a coffee field.
- Calculate an average. Enter the various shade readings into a spreadsheet and calculate a running average of them. As you enter the shade readings, look to see when the numbers settle around a consistent average. For example, consecutive percentage shade readings of 25, 45, 30, 45, 34, 49, 27, 38, 35, 51, 45, 37, 29, 28, 45 quickly converge to an average of 38% shade after about 10 readings. So for that particular shade configuration, a sample size of 10 may be sufficient.
- Take the shade level into account when evaluating yield, pests and disease levels to begin to determine the most compatible shade level for your circumstances (altitude, slope, orientation, soil, etc).
Repeat. For all project field plots, as well as other plots encountered that may have particularly good or poor coffee production, measure shade within plots three to four times per year.
Further Comments
This app is still being tested in c&c field plots but it seems to offer a quick and effective way of estimating shade that should be a major improvement on previous, mostly subjective, estimates. Macdonald & Macdonald (2016). HabitApp. Available at: https://play.google.com/store/apps/details?id=com.scrufster.habitapp&hl=en&utm_source=global_co&utm_medium=prtnr&utm_content=Mar2515&utm_campaign=PartBadge&pcampaignid=MKT-AC-global-none-all-co-pr-py-PartBadges-Oct1515-1
- Have something to add to this tool description? Leave a comment!
- Interested in applying this tool? Look for pictures, case studies and info sheets below for step-by-step instructions to get you started.


Hi,
Thanks for the review. Very useful.
Is there any chance to share the full reference for Macdonald & Macdonald 2016?
Many thanks.
Many thanks for the review. Very useful.
Is there any chance to have the full reference to MacDonald & MacDonald 2016? I’ve been trying to find it without luck.
Dear
the Application is not working in Ethiopia. as you know Ethiopia is one of the biggest provider of coffee for the world. can you check the app for Ethiopia?
Dear Abdurazak,
we are sorry you are experiencing problems with the usage of this app. Unfortunately we can not help as we are sorely advertising the app. Please contact Scrufster at info.xgeo@gmail.com directly.
what exactly does the “cut-off” mean, since this makes a significant difference in the value of the reading?